The ultimate goal of the Codee software suite is to help users achieve the peak performance of their software. One of the ways to do it is with a touch of parallelism. This post will talk about the NPB CG benchmark, a popular benchmark for comparing supercomputers, developed by NASA. We will talk about how our Codee can help users distribute their program’s workload to several CPU cores.
The workflow
The steps are as follows:
- We are assuming that you have a Linux system with GCC or Clang toolchains.
- We will download the source code of the benchmark.
- Compile it.
- Profile it to see where the hot spots are.
- Use Codee to automatically distribute the workload in hot loops to several CPU cores.
- And finally, we are going to measure the speed improvement.
Prerequisites
First, we will need to download the source code of NPB CG Benchmark. When you have the code, unpack it at a convenient location. You will also need our Codee tool (contact us for a demo), and perf profiler available in your Linux’ distribution repository.
The benchmark we are interested in is located in SNU_NPB-1.0.3/NPB3.3-SER-C/CG directory. Go to that directory and execute the following commands:
$ mkdir ../bin
$ make CLASS=C CC=clang CFLAGS="-O3 -g -fopenmp" CLINKFLAGS="-lm -fopenmp"
$ ../bin/cg.C.x
The make command will compile the benchmark for class C (class C means a large input size, you could also look up in the source code for other input sizes). With the last command the binary will start running the benchmark.
Finding the hot loops
To make our program run faster, first we need to find the code that takes the most time. We call this code hot code and we use tools called profilers to find it. On Linux, one of the most popular profilers is perf, which we will use here. To collect the profiling data and display the profile result, execute:
$ perf record --call-graph dwarf ../bin/cg.C.x
$ perf report
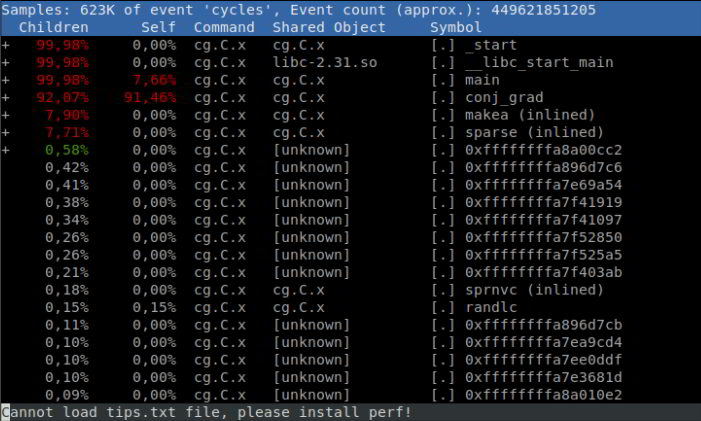
Command perf report opens perf’s text user interface where you can look around and see which functions take the most time. IBM has a full tutorial for using perf available here; we assume you are familiar with perf; if not, check it out. We are interested in functions that have a high percentage in the Self column. In our case, the function that clearly dominates the profile is conj_grad.
To see which code inside the function takes the most time, press the key A for annotation. Annotation in perf’s terminology means marking each instruction in the function with a percentage: how much time did the program spend doing that particular instruction.
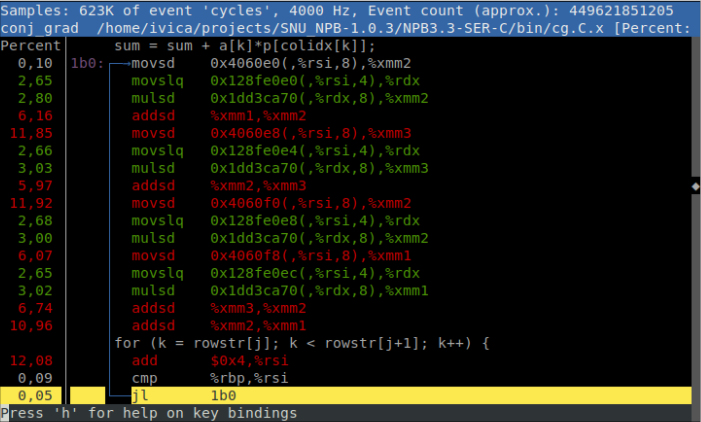
If we look at the perf’s output, we see that our program spends a lot of time running instructions belonging to the loop for (k = rowstr[j]; k < rowstr[j+1]; k++). If we add percentages for each instruction colored with red or green, it turns out 94,48% of the time is spent there. Here is the full source code of the loop with its surrounding loops:
 for (cgit = 1; cgit <= cgitmax; cgit++) {
    ...
    for (j = 0; j < lastrow - firstrow + 1; j++) {
      sum = 0.0;
      for (k = rowstr[j]; k < rowstr[j+1]; k++) {
        sum = sum + a[k]*p[colidx[k]];
      }
      q[j] = sum;
    }
   …
}
Before doing any parallelization effort, you should try to understand why your serial code is slow. Speeding up the serial code will almost always result in speeding up the parallel code. In this case, the reason for the slowness comes from data cache misses. The access to value p[colidx[k]] will almost always result in a data cache miss, and since this access is inside a triply nested loop, we can expect many cache misses. You can confirm the hypothesis by recording data cache misses using perf record -e cache-misses --call-graph dwarf ../bin/cg.C.x. The command will point you to the code where most cache misses occur.
Unfortunately, in this case no serial optimization would do the trick: there is no way we can refactor the code to avoid access to p[colidx[k]]. We might try to cache the values, e.g. p_tmp[k] = p[colidx[k]] since we are in the nested loop, but in this case, k always has a different value for all values of j. So, we have to look for performance elsewhere.
The magic of parallelism
Now when we know what is the code where our program spends most of its time, we can focus on speeding it up. We use Codee to do this automatically. It can detect the loops with parallelization potential and annotate them with OpenMP pragma 1. The runtime will then be able to distribute the loop to multiple CPU cores.
The steps to use Codee are as follows:
- Use
pwreport --evaluationto produce the entry-level performance optimization report for the input source code - Use
pwreport --actionsto display the details about the performance issues in the code and how to fix them - Use
pwdirectivesto automatically generate optimized code using OpenMP directives for multithreading - Measure the performance difference
Start using Codee by invoking the tool pwreport tool with the flag --evaluation. To include the performance optimizations related to multithreading use the flag --include-tags multi. The command looks like this:
$ pwreport --evaluation --include-tags multi cg.c -- -I ../common/
We are instructing pwreport --evaluation to perform the analysis on the file cg.c. In the command line, after --, we need to provide the same flags we are passing to the compiler. In our case we are providing -I../common, which means to look for headers in ../common directory. The output produced by Codee is as follows:
Compiler flags: -I ../common/

Target Lines of code Analyzed lines Analysis time # actions Effort Cost    Profiling
------ ------------- -------------- ------------- --------- ------ ------- ---------
cg.c   498           231            79 ms         12        144 h  4712€   n/a

ACTIONS PER STAGE OF THE PERFORMANCE OPTIMIZATION ROADMAP
Target Serial scalar Serial control Serial memory Vectorization Multithreading Offloading
------ ------------- -------------- ------------- ------------- -------------- ----------
cg.c   0             0              0             0             12             n/a

Target : analyzed directory or source code file
Lines of code : total lines of code found in the target (computed the same way as the sloccount tool)
Analyzed lines : relevant lines of code successfully analyzed
Analysis time : time required to analyze the target
# actions : total actionable items (opportunities, recommendations, defects and remarks) detected
Effort : estimated number of hours it would take to carry out all actions (serial scalar, serial control, serial memory, vectorization, multithreading and offloading with 1, 2, 4, 8, 12 and 16 hours respectively)
Cost : estimated cost in euros to carry out all the actions, paying the average salary of 56,286€/year for a professional C/C++ developer working 1720 hours per year
Profiling : estimation of overall execution time required by this target

SUGGESTIONS
  You can specify multiple inputs which will be displayed as multiple rows (ie. targets) in the table, eg:
        pwreport --evaluation some/other/dir --include-tags multi cg.c -- -I ../common/

  Use --actions to find out details about the detected actions:
        pwreport --actions --include-tags multi cg.c -- -I ../common/

  You can focus on a specific optimization type by filtering by its tag (serial-scalar, serial-control, serial-memory, vectorization, multithreading, offloading), eg.:
        pwreport --actions --include-tags serial-scalar cg.c -- -I ../common/

1 file successfully analyzed and 0 failures in 79 ms
This is Codee’s entry-level performance optimization report produced by the command pwreport --evaluation. It reports twelve (12) actions related to multithreading, and also suggests a subsequent command invocation pwreport --actions to find out details about the detected actions. We are interested in the hot loop at line 458 of the `cg.c:conj_grad` function. The corresponding command-line invocation is as follows:
$ pwreport --actions --level 2 --include-tags multi cg.c:conj_grad -- -I ../common/
Compiler flags: -I ../common/

ACTIONS REPORT

  FUNCTION BEGIN at cg.c:conj_grad:406:1
    406: static void conj_grad(int colidx[],
...
      LOOP BEGIN at cg.c:conj_grad:458:5
        458:     for (j = 0; j < lastrow - firstrow + 1; j++) {
        459:       sum = 0.0;
        460:       for (k = rowstr[j]; k < rowstr[j+1]; k++) {
        461:         sum = sum + a[k]*p[colidx[k]];
        462:       }
        463:       q[j] = sum;
        464:     }

        [OPP001] cg.c:458:5 is a multi-threading opportunity
          Compute patterns:
            - 'forall' over the variable 'q'

          SUGGESTION: use pwloops to get more details or pwdirectives to generate directives:
            pwloops cg.c:conj_grad:458:5 -- -I ../common/
            pwdirectives --omp multi cg.c:conj_grad:458:5 --in-place -- -I ../common/

          More information on: https://www.appentra.com/knowledge/opportunities

      LOOP END
...
  FUNCTION END

CODE COVERAGE
  Analyzable files:            1 / 1     (100.00 %)
  Analyzable functions:        1 / 1     (100.00 %)
  Analyzable loops:           12 / 12    (100.00 %)
  Parallelized SLOCs:          0 / 55    (  0.00 %)

METRICS SUMMARY
  Total recommendations:         0
  Total opportunities:           8
  Total defects:                 0
  Total remarks:                 0

SUGGESTIONS

  8 opportunities for parallelization were found in your code, get more information with pwloops:
        pwloops cg.c:conj_grad -- -I ../common/

  More details on the defects, recommendations and more in the Knowledge Base:
        https://www.appentra.com/knowledge/

1 file successfully analyzed and 0 failures in 56 m
For this loop, we obtain a forall multi-threading opportunity for the variable q. A forall pattern in a loop is a pattern where each iteration of the loop modifies a single element of the output array, and each iteration does work independently of the other iterations. Multi opportunity is a contraction for multithreading, which means that the loop can be parallelized by distributing it to multiple CPU cores.
In the suggestion attached to the multi-threading opportunity, it is possible to see the command to auto parallelize the loop using pwdirectives. Let’s do it in a simple manner, by copying and pasting the suggested command:
$ cp cg.c cg-original.c
$ pwdirectives --omp multi cg.c:conj_grad:458:5 --in-place -- -I ../common/
Compiler flags: -I ../common/

Results for file 'cg.c':
  Successfully parallelized loop at 'cg.c:conj_grad:458:5' [using multi-threading]:
      [INFO] cg.c:458:5 Parallel forall: variable 'q'
      [INFO] cg.c:458:5 Loop parallelized with multithreading using OpenMP directive 'for'
      [INFO] cg.c:458:5 Parallel region defined by OpenMP directive 'parallel'
Successfully updated cg.c

Minimum software stack requirements: OpenMP version 2.0 with multithreading capabilities
The replacement is done in place with the command line switch --in-place. To show you the changes done by Codee, find below the output of the diff tool and the OpenMP-enabled loop:
$ diff cg-original.c cg.c
457a458,460
> 	#pragma omp parallel default(none) shared(a, colidx, firstrow, lastrow, p, q, rowstr) private(j, k, sum)
> 	{
> 	#pragma omp for private(k, sum) schedule(auto)
464a468
> 	} // end parallel
$ less cg.c
...
#pragma omp parallel default(none) shared(a, colidx, firstrow, lastrow, p, q, rowstr) private(j, k, sum)
{
#pragma omp for private(k, sum) schedule(auto)
for (j = 0; j < lastrow - firstrow + 1; j++) {
sum = 0.0;
for (k = rowstr[j]; k < rowstr[j+1]; k++) {
sum = sum + a[k]*p[colidx[k]];
}
q[j] = sum;
}
} // end parallel
...
Codee added two OpenMP pragmas to allow distributing the loop to multiple CPU cores. It marked the variables as private or shared, depending on the pattern they should be used in when running in multithreaded settings.
The results
Command pwdirectives has created a parallelized version of our loop. Now we need to recompile it. But before doing that, let’s measure how much time does the original program take. You may use the time command:
$ time ../bin/cg.C.x
Subscribe to our newsletter
and receive in-depth technical articles, white papers, videos, webinars, product announcements, and more.
Now, let’s recompile it with multithreading and measure the difference. To recompile and run the multithreaded version:
$ make CLASS=C CC=clang CFLAGS="-O3 -g -fopenmp" CLINKFLAGS="-lm -fopenmp"
$ time ../bin/cg.C.x
We measured the speed difference on a general purpose AMD Ryzen 7 4800H laptop with 8 cores and 16 hardware threads, 16 GB of memory, Ubuntu 20.04 operating system and CLANG 10 compiler. Here are the results:
The multithreaded version is 3 times faster than the original version. A nice improvement with a little effort!
A few concluding remarks
In this example, we showed how focusing on hot loops together with distribution to multiple cores can help speed up our program. Codee did all the dirty work for us, so we were running our program at full speed very quickly.
Although Codee detected many parallelization opportunities, we decided to parallelize only one hot spot. Why? Parallelization by distributing the workload to several cores is not a magic solution to every performance issue. It takes time to spawn several threads and divide the workload among them, so this kind of optimizations pays off only for significant workloads. The idea to parallelize every possible loop regardless of its trip count would bring severe performance degradation.
A question you might be asking yourself is why the speedup is not proportional to the number of threads? If the serial version took 141.4 seconds, we could expect that the version with four threads takes one fourth of that and the version with sixteen threads takes one sixteenth. This can actually happen in some applications, but in this particular case the reason for the slowness was not the lack of computational power, but the lack of memory bandwidth. All the cores share access to the same memory, and this bandwidth is limited. That is the reason why the speed up is not proportional to the number of threads and also the reason why the version with 4 threads is only slightly slower (52.1 seconds) compared to the version with 16 threads (45.7 seconds).
Related resources
- Knowledge Base of the Codee tool
- NASA – NAS Parallel Benchmarks (NPB)
- Seoul National University – SNU NPB Suite
- IBM Developer – Analyzing performance with perf annotate
1 Note: OpenMP is the de facto industry standard when it comes to distributing workloads to several CPU cores. All the major compilers support it. It uses compiler pragmas to instruct the compiler and the runtime on how to distribute the workload to several CPU cores.
Build correct, secure, modern and fast Fortran, C and C++ scientific software
Leave a Reply