There are worlds where performance matters. For example HPC world: faster software means less wait time for the scientists. Embedded world: faster software means we can use cheaper silicon to build our product. Game world: faster software means that our game will run on slower CPUs, thus making our game more interesting to people with low-end hardware. When we are investigating a performance-critical piece of code, we might ask ourselves: is it possible to go faster?
In this post we will talk about exactly that: how to determine if our algorithm is running at peak performance. For this, we will introduce the roofline model, a theoretical model that allows us to understand how loops in our program consume CPU’s computational resources and memory bandwidth.
The roofline model
When it comes to peak software performance, there are theoretical limits on the performance that depend on the hardware. Some programs use the provided resources optimally, others don’t. To figure out if we are running at peak performance, let us introduce the roofline model.
The best way to introduce the model is to start with parts that make it. For this reason, here are two example codes:
float calculate_sum(float a[], int N) {
    float sum = 0;
    for (int i = 0; i < N; i++) {
        sum += a[i];
    }
    return sum;
}
void calculate_distance(float x[], float y[], int N, float distance[]) {
for (int i = 0; i < N; i++) {
for (int j = 0; j < N; j++) {
float x_dist = x[i]- x[j];
float y_dist = y[i] - y[j];
distance[j + i * N] = sqrt(x_dist*x_dist + y_dist*y_dist);
}
}
}The loop in calculate_sum runs through the array a and sums all the elements of the array. The loop in calculate_distance runs through a list of 2D points and calculates the distance between each pair of them.
In terms of number of operations, the calculate_sum loop, for each iteration of the loop, loads one float from the memory and performs one floating-point addition operation. The calculate_distance loop loads four floats and stores one float, and also performs thirteen floating-point operations (two subtractions, two additions, three multiplications, and a square root which counts as six floating-point operations).
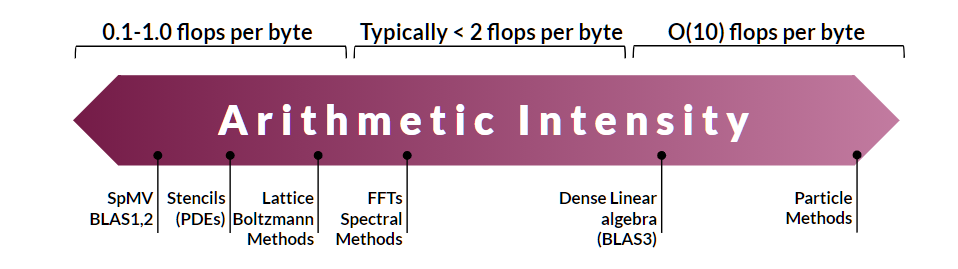
The ratio between the number of executed operations and the number of bytes transferred between the CPU and the memory is called arithmetic intensity. Assuming the size of a float is 4 bytes, in the case of calculate_sum loop, we have a computational intensity of 0.25. In the case of calculate_distance loop, we have a computational intensity of 13 / (5 * 4) = 0.65.
Smaller arithmetic intensity means a larger pressure on the memory subsystem, and conversely, larger arithmetic intensity means a larger pressure on the CPUs computational resources. There is no exact point where this transition happens; it will depend on the machine you are running your code. In our example, the function calculate_sum puts higher pressure on the memory subsystem, and the function calculate_distance puts higher pressure on the computational resources of the CPU. But how does that relate to the peak performance?
This is where the roofline model steps in. For a loop with a fixed arithmetic intensity there is an upper limit on the number of floating-point operations per second (FLOPS). This is conveniently represented as a two-dimensional graph:
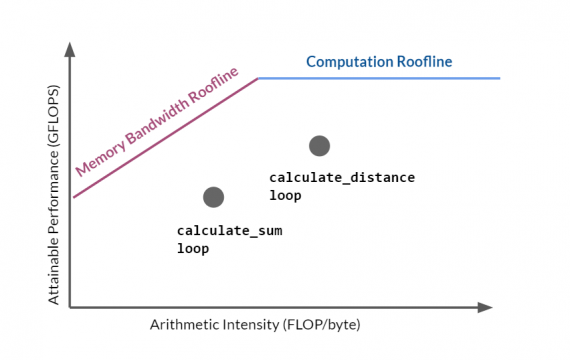
The X-axis represents the arithmetic intensity in FLOP/byte, and the Y-axis represents the number of floating-point operations per second. The performance of a loop is represented as a dot in the diagram: the X-axis represents the loop’s arithmetic intensity (which can be calculated easily, as shown earlier) and Y-axis represents the number of floating-point operations per second (abbreviated with FLOPS)1.
There are two rooflines visible in the graph: the memory bandwidth roofline which comes from the limited memory bandwidth between the memory and the CPU, alternatively, the computation roofline comes from the limited amount of computational resources in the CPU.
The closer the point representing the loop is to the roofline, the better it is at utilizing the available hardware resources. For loops with a low arithmetic intensity, the limit is the memory bandwidth roofline, for the loops with a high arithmetic intensity, the limit is determined by CPU’s computation roofline.
Your loop is reaching its peak performance if the dot representing it is close to the roofline. Ideally you want to come close to this limit line as much as possible. But beware! While you are tuning your loop you will certainly experience that after some modification you get the better FLOPS metrics, yet the loop is slower. This is because the FLOPS metric represents speed. Your loop might become indeed faster, but if your modification has increased the amount of work the loop has to do, the end result will be a loop that executes in more time. For example, a binary search algorithm will have worse speed in FLOPS metrics than a linear search, however, binary search is faster because it executes much less instructions than linear search.
The rooflines in the roofline model
When we presented the roofline model, we said there are two rooflines in the model, the memory bandwidth roofline and the computation roofline. However, the story is more complicated than that.
Modern CPUs have a complicated memory hierarchy consisting of several levels of data caches (L1, L2, L3) and DRAM. Each of these memories has its own maximum bandwidth: L1 cache has the highest bandwidth, followed by L2 and L3 cache, followed by DRAM. Each of this memories has its own memory bandwidth roofline.
The computation roofline is also not fixed. There is one roofline for scalar code, another for scalar code with fused multiply-add, yet another for vectorized code, and another if you are running your algorithm on several CPU cores.
Here is the roofline for our two loops from the previous example. The source code is available in our repository:
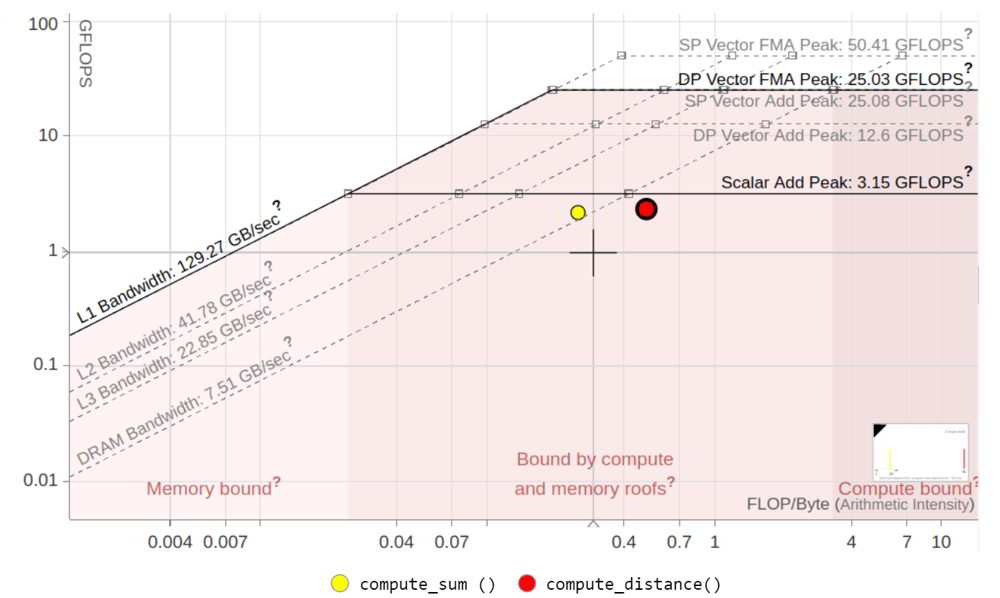
There are different rooflines for different types of memory: DRAM memory has the lowest roofline, followed by L3, L2 and L1 caches. Any effort to increase data cache locality will result in a higher FLOPS metric, i.e. the point will move upward and you should expect the increase in speed.
There are also different rooflines when it comes to computations: scalar add peak, single precision vector peak and double precision vector peak. These are related to the type of instructions the compiler generated: scalar instructions, vector instructions with doubles or vector instructions with floats. In case you are using a multicore system, your roofline model will have additional memory and computation rooflines to reflect the additional hardware resources.
In the above diagram, the yellow dot represents the measurement for the loop in calculate_sum, the red dot represents the loop in calculate_distance. As you can see both loops are close to the DRAM bandwidth roofline for their arithmetic intensity, and since the input array is 100 million floats, both loops are using the resources very efficiently.
Plotting the roofline diagram
When it comes to plotting the roofline diagram, there are two approaches: manual and automatic.
The manual approach consists of calculating the arithmetic intensity manually, running a set of prepared benchmarks to determine the memory bandwidth roofline and computation roofline and finally, measuring the FLOPS for the loop of interest and plotting it on the diagram. Arithmetic intensity is calculated manually and measurements are made using LIKWID Performance Tools that allows you to perform the necessary measurements. You can find information about manual roofline plotting in LIKWID’s documentation.

Subscribe to our newsletter
and receive in-depth technical articles, white papers, videos, webinars, product announcements, and more.
For automatic measuring and plotting there is Intel’s Advisor, a graphical user interface that is simple to use. It will perform all the steps: arithmetic intensity calculation, measurements, limit calculation and create a very nice diagram that contains a dot for each significant loop in your program. Loops that take a lot of time will be bigger and in brighter colors. But, alas, it only works on Intel’s CPU!
Intel’s Advisor takes some time to master, if you are interested in a tutorial on how to use it to plot a roofline diagram, check out here.
Performance improvement tips
In case your loop is not reaching its full potential, a question is what kind of source code optimization can you do to speed it up. The answer to that question depends on the arithmetic intensity.
Memory roofline
If the arithmetic intensity of the loop is low, the loop is memory bound. Typically, techniques used to improve memory access pattern and data locality will result in better usage of available memory bandwidth and speed-ups. Some of these are:
- Loop interchange: an optimization where we interchange two nested loops to improve the memory access pattern. A very nice demonstration of that technique is presented in our post about the improvements we did in the Canny edge detector algorithm.
- Loop tiling: a technique that, although it increases the amount of computations that needs to be done, also increases the data locality.
- Class/struct splitting: in case your class or struct has members you are not using in your performance critical loop, moving those to another class/struct will increase the data locality and the performance
- Moving from arrays-of-structs to struct-of arrays: this is an extreme of the above recommendation of class/struct splitting. We get rid of the array of struct altogether; each of the struct’s members will be stored in a separate array. This guarantees the best data cache usage and allows the compiler to efficiently vectorize our code.
- Use cache-friendly data structures. For instance, instead of AVL trees, consider using red-black trees; instead of regular hash maps, consider using open addressing hash maps.
This is not an exclusive list. There are many other ways to increase data locality, some of them are really clever. For example, if you have two loops running over the same set of data, where the first one is arithmetically intensive and the other one is not, fusing the loops might give you better runtime altogether because of the more balanced use of resources.
Computation roofline
As the arithmetic intensity grows, fetching data from memory becomes less and less of a bottleneck. Instead, the computational resources become the limit. Common techniques to increase the computation roofline include:
- Break instruction dependency chain: if the current iteration of the loop depends on the previous iteration, this can severely limit the available instruction level parallelism 2 (abbreviated ILP). Every effort in breaking the dependency chain will lead to better usage of ILP, and allow for other techniques to increase the performance of your loop.
- Techniques that balance the use of CPU’s resources: doing three load instructions, followed by three add instructions, followed by three sqrt instructions uses the CPU’s resources in an unbalanced way. Any approach to move to a more balanced usage of different CPU’s resources will help the GFLOPS metric. For example, compilers often use a technique called software pipelining, where they unroll a loop several times and shuffle the instructions in order to use the CPU’s resources in a more balanced way.
- Enable auto-vectorization: the CPU contains special registers and circuitry to manipulate vectors of data. Compilers will use these instructions when possible, but in many occasions the compiler will fail to vectorize a loop. In that case it is worth looking at the compiler vectorization report to see what loops are not vectorized and try to fix any problems. Intel has a very good vectorization instruction manual; also, information on autovectorization with CLANG can be found in Denis Bakhvalov’s Performance Analysis book 3.
- Explicit vectorization: Sometimes, a particular loop cannot be expressed in such a way that auto-vectorization is possible, yet it can profit from vectorization. In that case, developers can use explicit vectorization, either by using SIMD intrinsics, vectorization libraries (Agner’s VCL library, EVE or std::experimental::simd), compiler pragmas (OpenMP SIMD pragmas or compiler specific pragmas) or languages with explicit vectorization, such as ISPC. Our tool Codee allows the developers to automatically add vectorization pragmas to their source code.
- Distribute the loop to multiple CPU cores: nowadays most CPUs, including embedded CPUs, have more than one core. Distributing the loop will lead to greater FLOPS and greater speed, albeit with increased power consumption. Standard choice for this method is OpenMP, a set of compiler pragmas that allows developers to simply distribute a loop to multiple CPU cores. Our Codee allows the developers to automate this task by detecting parallelization opportunities and emitting OpenMP pragmas. Alternatively, if more control is needed, the developers have a choice of POSIX C library for multithreading, Intel’s TBB or
std::threadin C++.
Our loop is optimal, is that all?
In case your loop is close to its full potential, you might be asking yourself: is that all? The roofline model shows if you are close to the hardware limits, but it doesn’t count for unnecessary spent cycles, so it can be misleading. Take for example linear search versus binary search. Linear search can use hardware resources very efficiently, but binary search will be much faster because the number of executed instructions is much much lower.
Another example is strength reduction, a technique where we replace slow instructions with faster ones. For example, replacing division by power of two with shifting or using faster but less precise instructions will not be suggested by the roofline model.
Sometimes the loop does unnecessary computations. The roofline model will not tell you if you are running computation needlessly, as it will report an optimal resource usage. It is for the developer to pay attention to the details.
Conclusion
The roofline model is very good when you need to determine if your loop is running in its full potential. It allows you to get a quick overview of loops that have the most optimization potential. The model is one of the tools in the performance developer’s toolbox, along others, that will help them write fast and efficient code.
In the upcoming post we will go into details with different versions of the Canny algorithm we optimized in posts 1 and post 2 and see how changes we made reflect in the roofline model.
Resources
- Case Study: How we made the Canny edge detector algorithm run faster? (part 1), where we optimized the memory access pattern of critical loops in order to get better speed.
- Case Study: How we made the Canny edge detector algorithm run faster? (part 2), where we used OpenMP compiler directives to distribute the processing to several CPU cores.
- LIKWID Performance Tools, a set of tools used for manually plotting the roofline model
- Tutorial: Empirical Roofline Model using LIKWID
- Intel® Advisor Tutorial for Using the Automated Roofline Chart to Make Optimization Decisions
- Denis Bakhvalov, Performance Analysis and Tuning on Modern CPUs, chapter 8.2.3.1 “Compiler Autovectorization”
- A Guide to Vectorization with Intel® C++ Compilers
- Agner’s VCL Library, library used for explicit vectorization
- EVE – the Expressive Vector Engine, another C++ library used for explicit vectorization
- std::experimental::simd, part of C++ STL used for explicit vectorization
- Effective Vectorization with OpenMP 4.5
- Intel® Implicit SPMD Program Compiler, a compiler for ISPC language which supports explicit vectorization natively
1 In this article we are dealing with processing floating-point numbers. In case your program processes integers (which is the case in many applications, e.g. databases), the CPU uses a completely different set of hardware resources. The performance of integer operations is measured in INTOPS. Performance analysis for integer operations is still a work in progress. More information in Intel’s Advisors documentation.
2 Modern CPUs can execute instructions out-of-order. If the operands of the current instruction do not depend on the result of the previous execution, the CPU can execute the current instruction immediately, without waiting for the previous instruction to complete. Code where the instructions do not depend a lot on one another have a higher ILP. The compilers can rearrange the instructions to allow more ILP for the CPU.
3 Denis Bakhvalov, Performance Analysis and Tuning on Modern CPUs, chapter 8.2.3.1
Build correct, secure, modern and fast Fortran, C and C++ scientific software
Cibin says
Thanks for the absolutely wonderful explanation on rooflines!
Luzato says
Nice and clear explanation ( review) along with resources to refer to. Thanks!